
Doji Candlestick Pattern Explained: What It Signals for Traders
SAHI
In the world of technical analysis, candlestick patterns offer traders valuable insights into market sentiment. Among them, the Doji candle stands out as a key indicator of indecision, often signaling potential trend reversals or pauses in market momentum. For traders focusing on futures and options, recognizing and interpreting Doji candles can be an essential tool in making informed trading decisions.
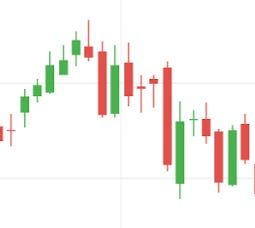
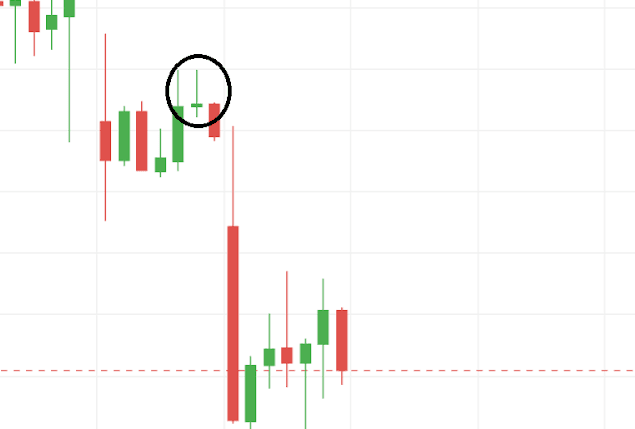
A Doji candle forms when an asset's opening and closing prices are nearly identical, creating a candle with a very small or non-existent body. This indicates that neither buyers nor sellers have gained control, leading to market uncertainty. While the high and low prices may vary, the key takeaway is that the market lacks a clear directional bias.
Types of Doji Candles & Their SignificanceThere are several variations of the Doji candle, each with its own implications:
Standard Doji: A basic Doji with a small body and equal upper and lower wicks, reflecting equilibrium in market sentiment.
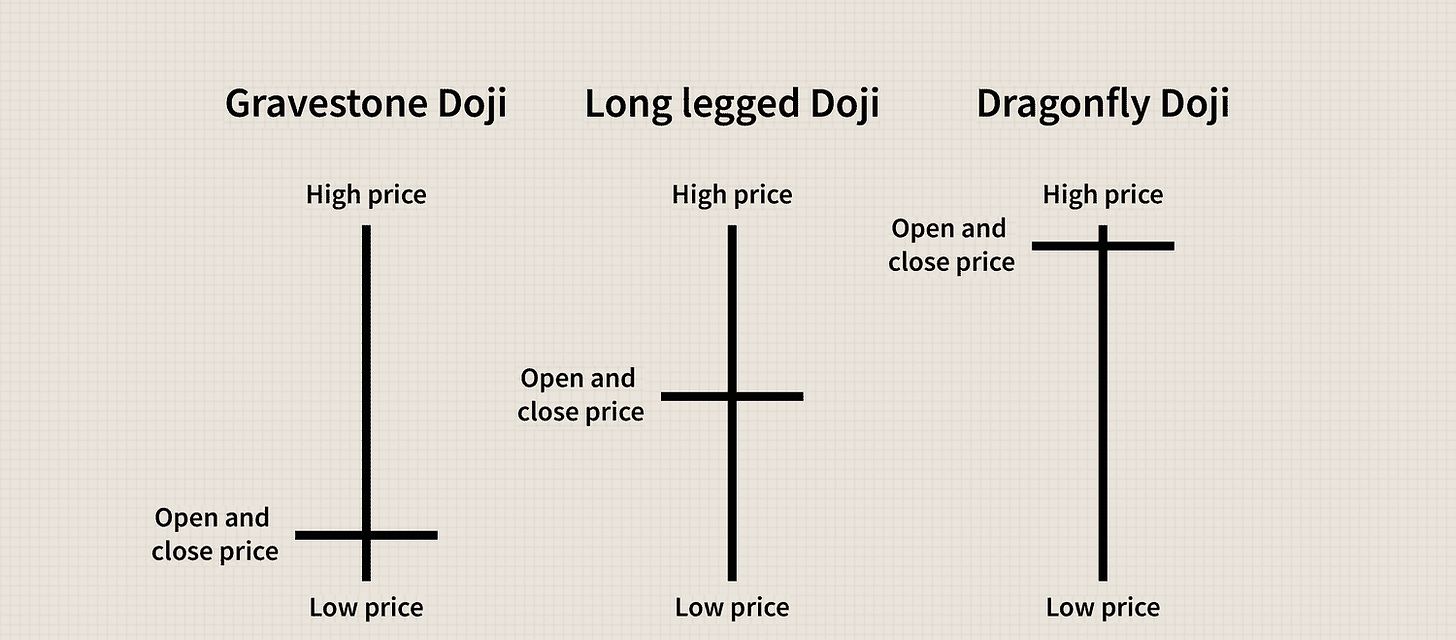
Dragonfly Doji: Has a long lower wick and little to no upper wick, indicating that sellers pushed the price lower but buyers regained control. This may signal a bullish reversal if found at the bottom of a downtrend.
Gravestone Doji: Features a long upper wick and little to no lower wick, suggesting that buyers initially drove prices up but sellers took control. When spotted at the top of an uptrend, it can indicate a bearish reversal.
Long-Legged Doji: Displays extended wicks on both sides, highlighting heightened volatility and significant market indecision.
The Doji candle is most powerful when combined with other indicators and patterns. Here’s how traders can leverage it:
Confirming Trend Reversals: A Doji appearing after a strong bullish or bearish trend may suggest that momentum is weakening. Traders often look for confirmation in the following candles before making their move.
Support & Resistance Levels: When a Doji forms at key levels, it reinforces the potential for price reversals.
While the Doji candle is not a standalone signal, it plays a crucial role in technical analysis. For futures and options traders, understanding how to interpret Doji formations can provide valuable clues about market direction and potential trade opportunities.Indicators like RSI, MACD, and Bollinger Bands can help confirm whether a Doji signals a true reversal or just temporary hesitation.
Have you encountered Doji candles in your trading journey? Share your thoughts in the comments!
Related
Market Minute | November 17, 2025
🚀 Nifty50 finds support at 25.7K, IT slips, PSU Banks gain: Top movers & key levels to watch!
Nifty Intraday Analysis Today (12 December 2025): Support, Resistance & Option Chain View
Market Minute | October 24, 2025
Recent
What is an IPO & How to Apply for an IPO on Sahi: Step-by-Step Guide
Indicator Templates: Build Once. Trade Faster Forever.
Pledging in Trading: How Traders Use Their Portfolio as Trading Capital
How to Read the Option Chain to Predict Market Moves in Weekly Expiries?
Bharat Coking Coal IPO Lists at 96% Premium: Market Verdict Defies GMP Cool-Off