
What’s New on Sahi | Anchored Text + Smarter Drawing Settings
TeamSahi
This week’s release focuses on making charting feel more natural and organised. We’ve added two improvements that help you capture your thought process more clearly and reduce repetitive work while analysing markets.
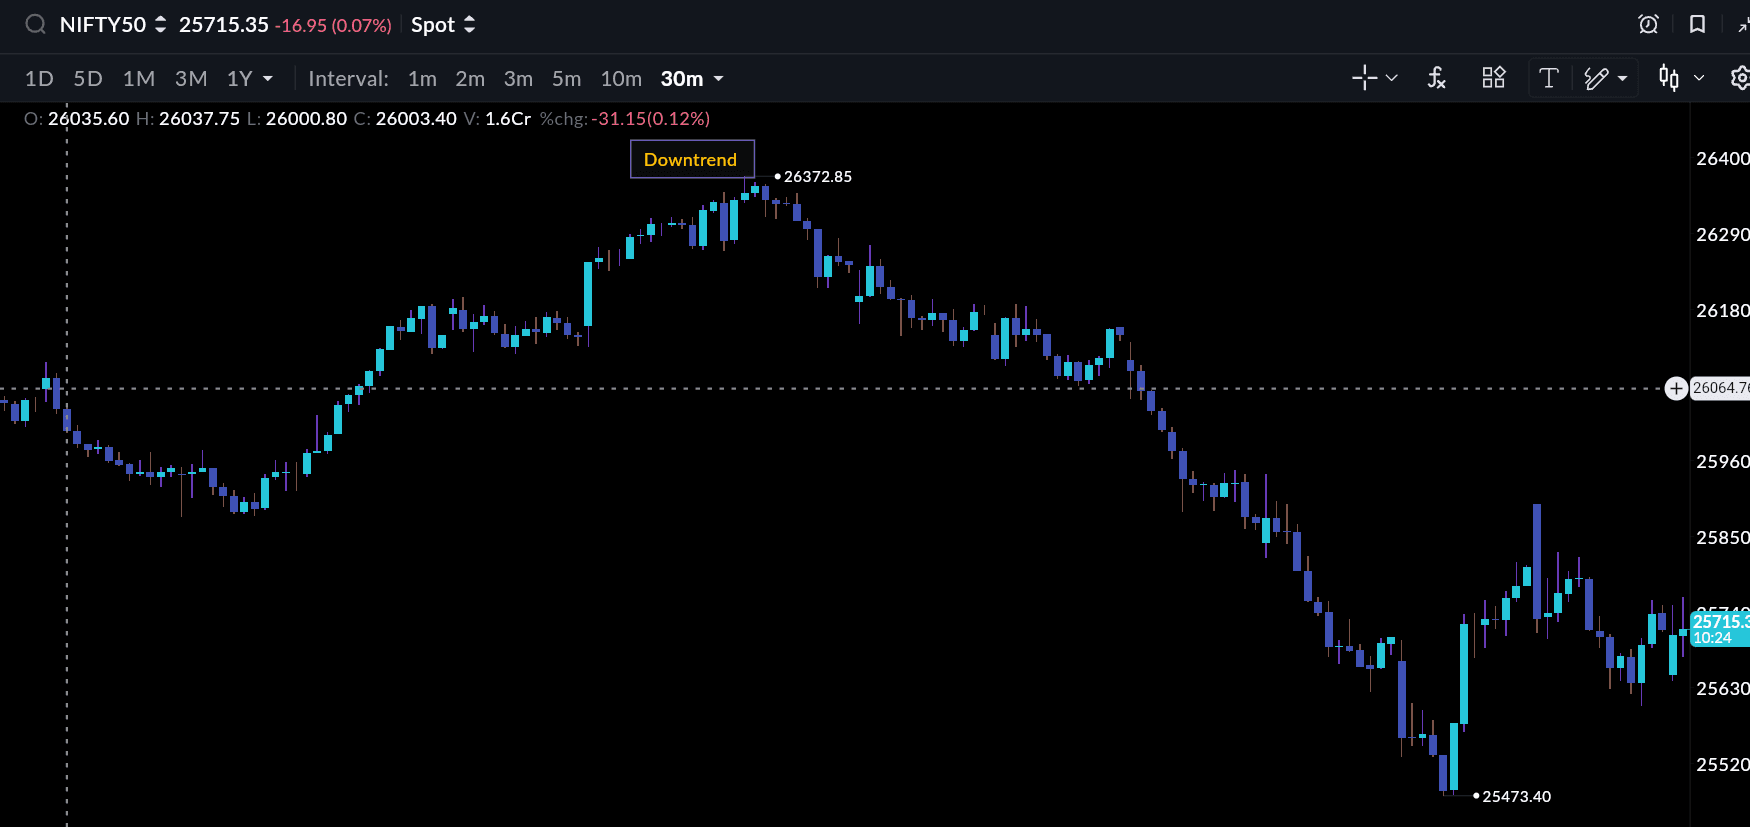
Anchored Text on Charts
You can now add text directly on your charts and keep it fixed to the exact price level you’re studying. This helps when you want to note why a level matters, what you’re expecting next, or simply mark an observation without leaving the chart. The text stays anchored even as you switch devices, and you can adjust the colour, size, background and style to keep things readable.
Overall, it gives you a simple way to maintain context on your setups and store your analysis in the same place where you actually see the price action.
Drawing Tools That Remember Your Settings
Most traders follow a consistent system when drawing trendlines, channels or zones. Until now, you had to restyle each drawing manually. With this update, Sahi automatically remembers the colour, thickness and other settings you last used and applies them to your next drawing.
What this improves
- Less time spent adjusting colours and line widths
- Cleaner, more consistent charts
- Faster marking of zones, trendlines, and structures
- Useful for traders who draw frequently through the day
This small quality-of-life change adds up when you're analysing multiple charts or working through quick intraday setups.
What’s next
We’re continuing to refine the charting experience and are working on improvements across indicators, OI visuals and desktop workspaces. As always, your feedback guides our priorities keep sharing what you need.
Related
New Feature Drop: Kill Switch, P&L Calendar & 52-Week High/Low
New on Sahi | Lock Your Drawings, Camarilla Pivots & Real-Time Sync
What’s New on Sahi | Dual Charts for Calls & Puts in Scalper Mode
Quick Tour is here in Scalper Mode!
Recent
What is an IPO & How to Apply for an IPO on Sahi: Step-by-Step Guide
Indicator Templates: Build Once. Trade Faster Forever.
Pledging in Trading: How Traders Use Their Portfolio as Trading Capital
How to Read the Option Chain to Predict Market Moves in Weekly Expiries?
Bharat Coking Coal IPO Lists at 96% Premium: Market Verdict Defies GMP Cool-Off